Analyzes the impact of a competitor entering an adjacent market.
Author
Daniel Carpenter, MS
Published
2022
NoteNote: Data is Randomly Generated
For demonstration purposes, the data are randomized and all naming is fictitious.
View Code Here
# Load packages and functionssource('docs//00-Reused-Code/Read-Library-and-Functions.R')set.seed(1024) # All data is randomized! Seed set for reproducibilitythis_dir <-'docs//01-Visual-Storytelling//02-Post-Mortem//'# Date of the Competitor Entry:date_competition_enters =Sys.Date() -120selected_stores =c('Flagship Store' )# Read in a reference file for drive times destinationsdt_ref <-fread(paste0(this_dir, 'data//drivetime_ref.csv'))# Get the R files containing the functions with plots --------------------------purrr::walk(list.files(paste0(this_dir, 'functions//'), pattern ="\\.R$", full.names =TRUE), source)
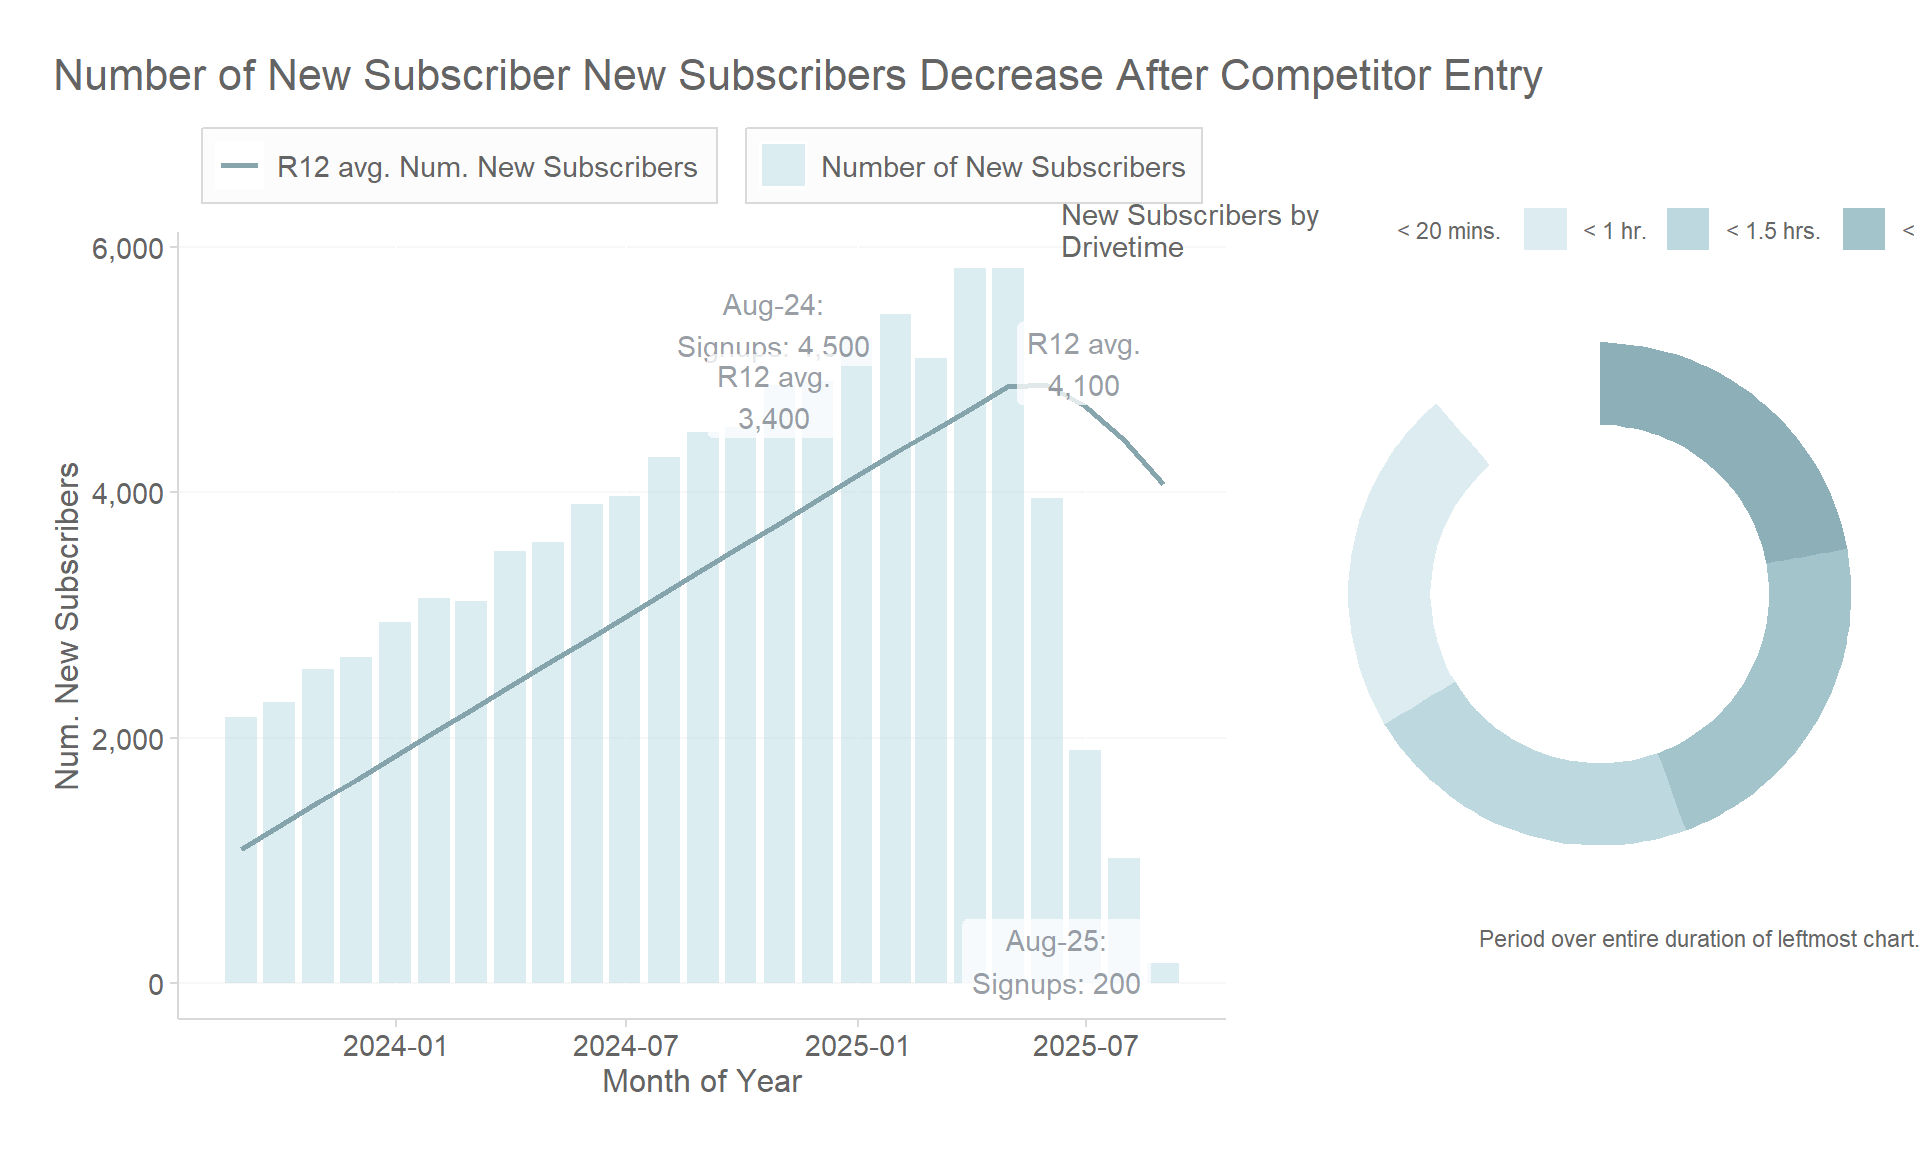
Within the deliverable, this analysis shows that core KPIs soften across stores, suppliers, in-store sections, and subscribers.
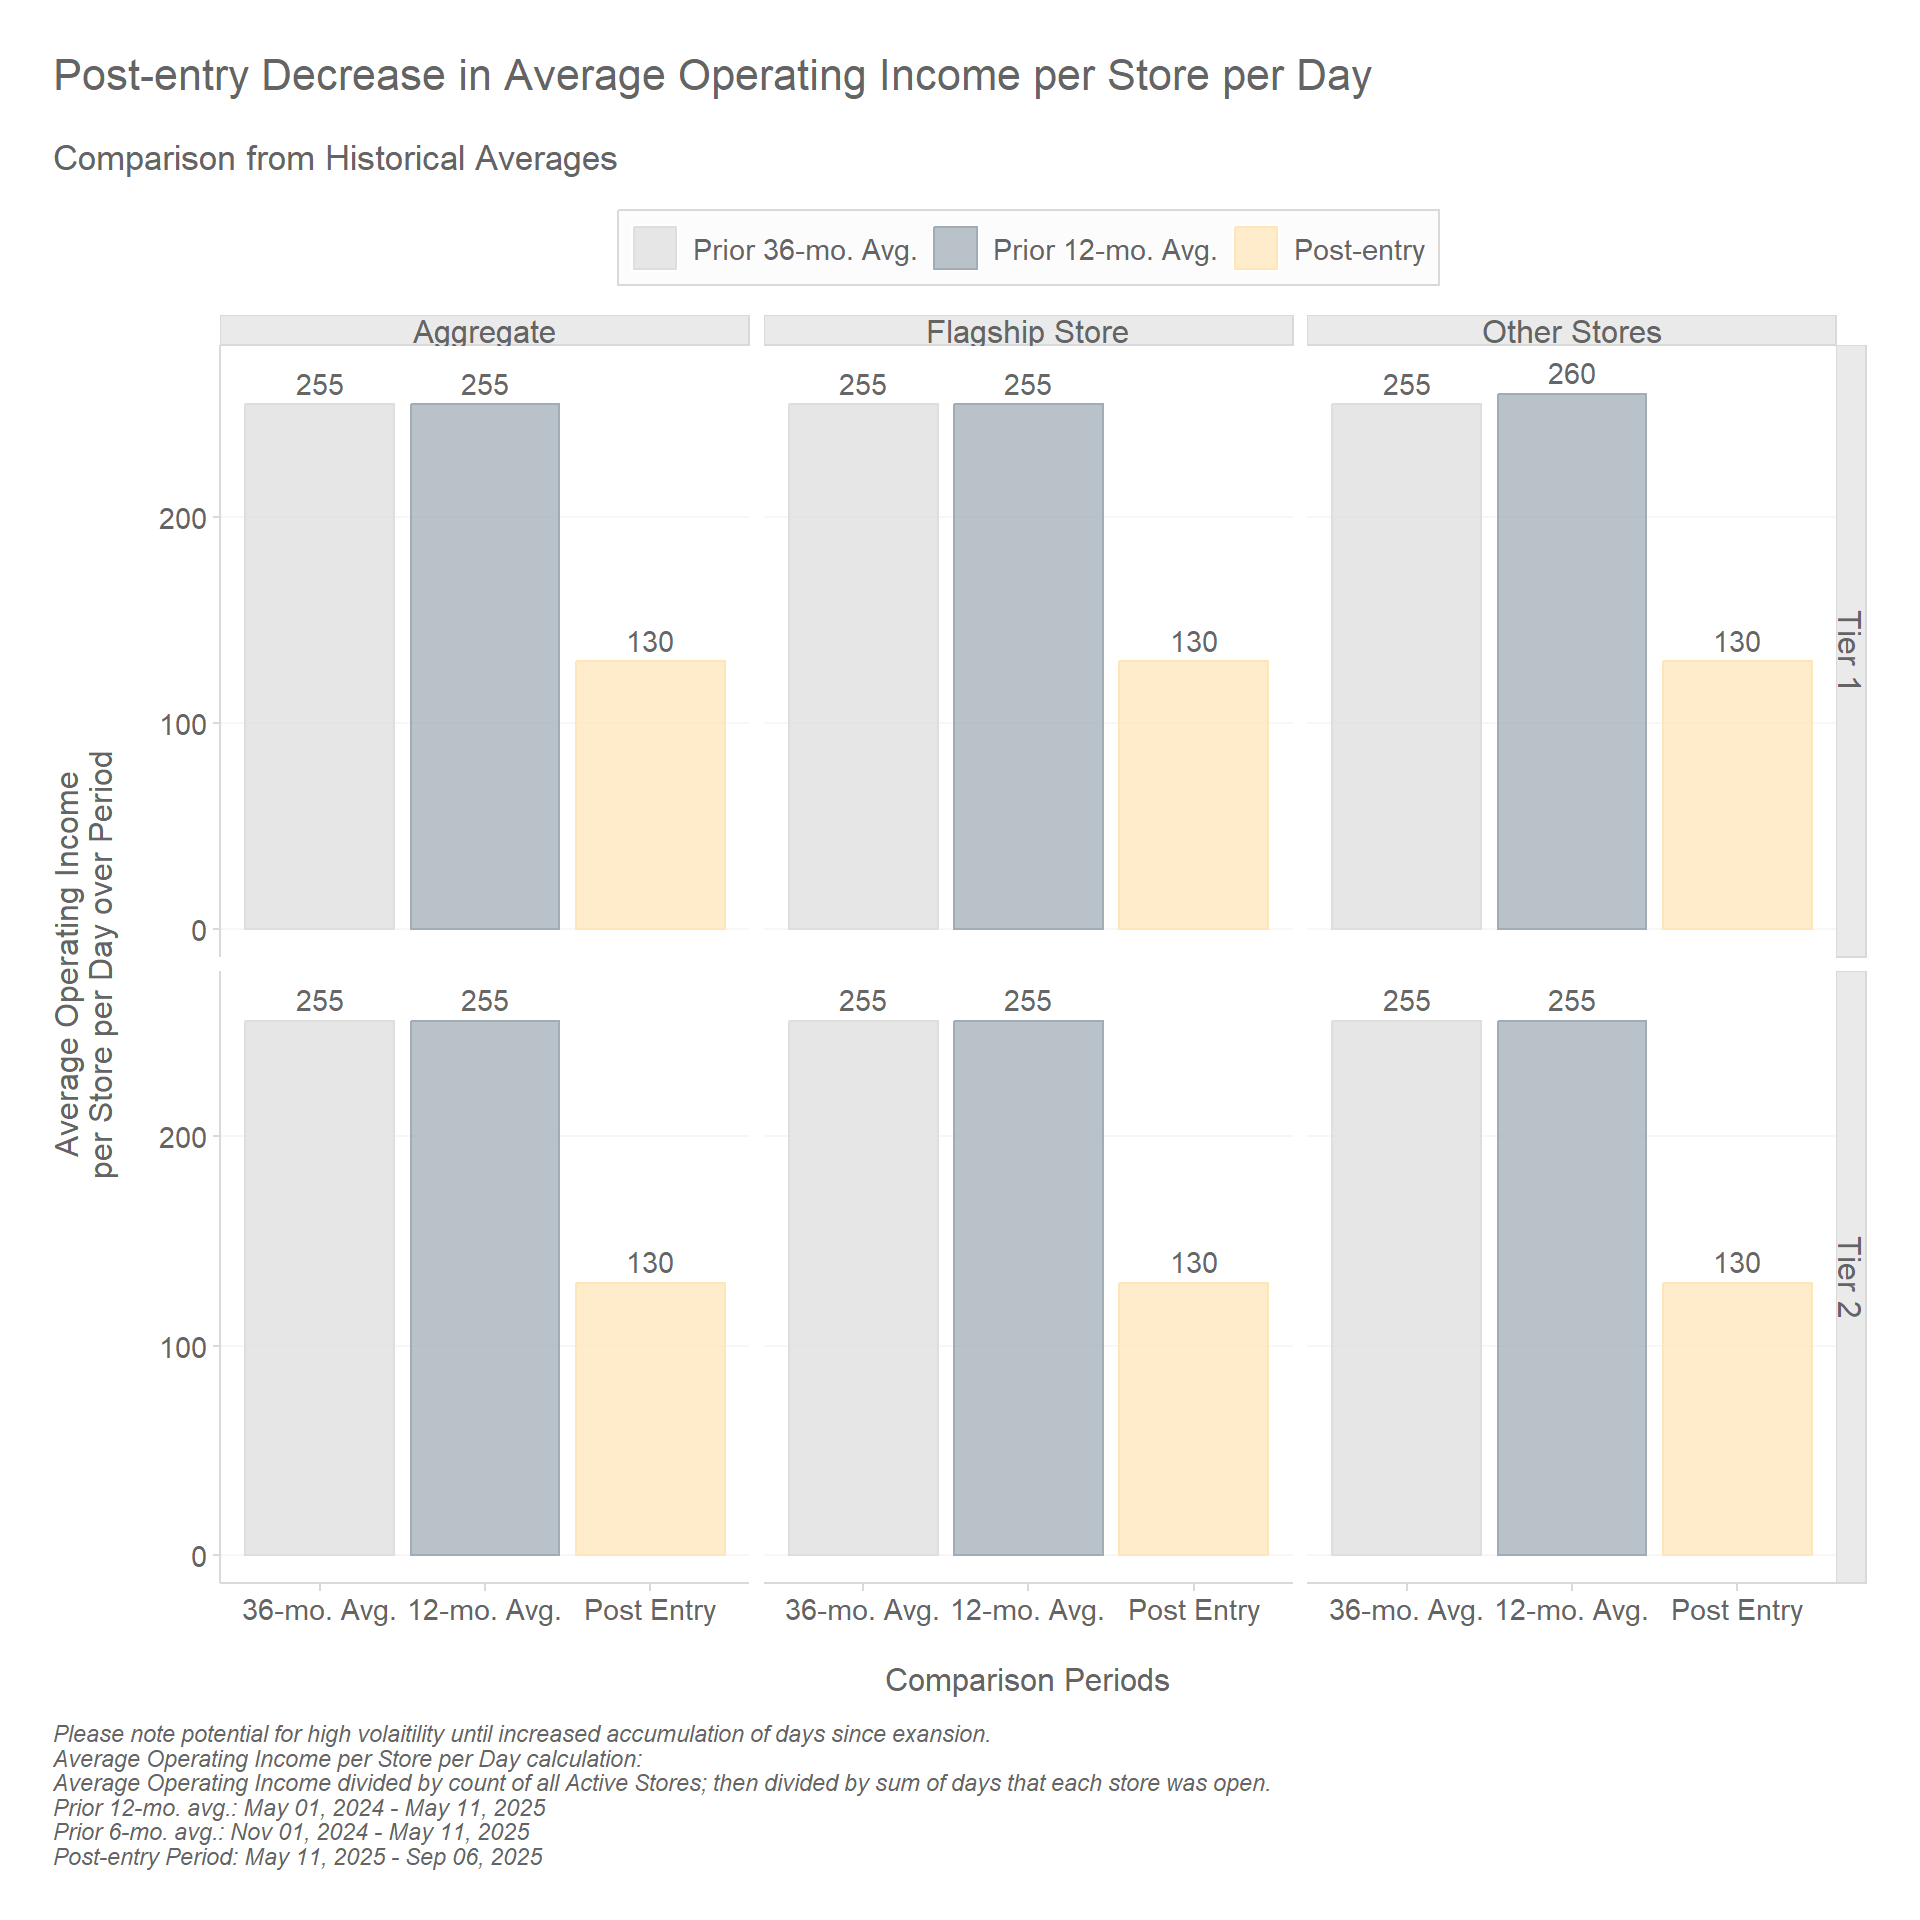
1 Enterprise Operating Income per Store per Day Declines After Competitor Entry
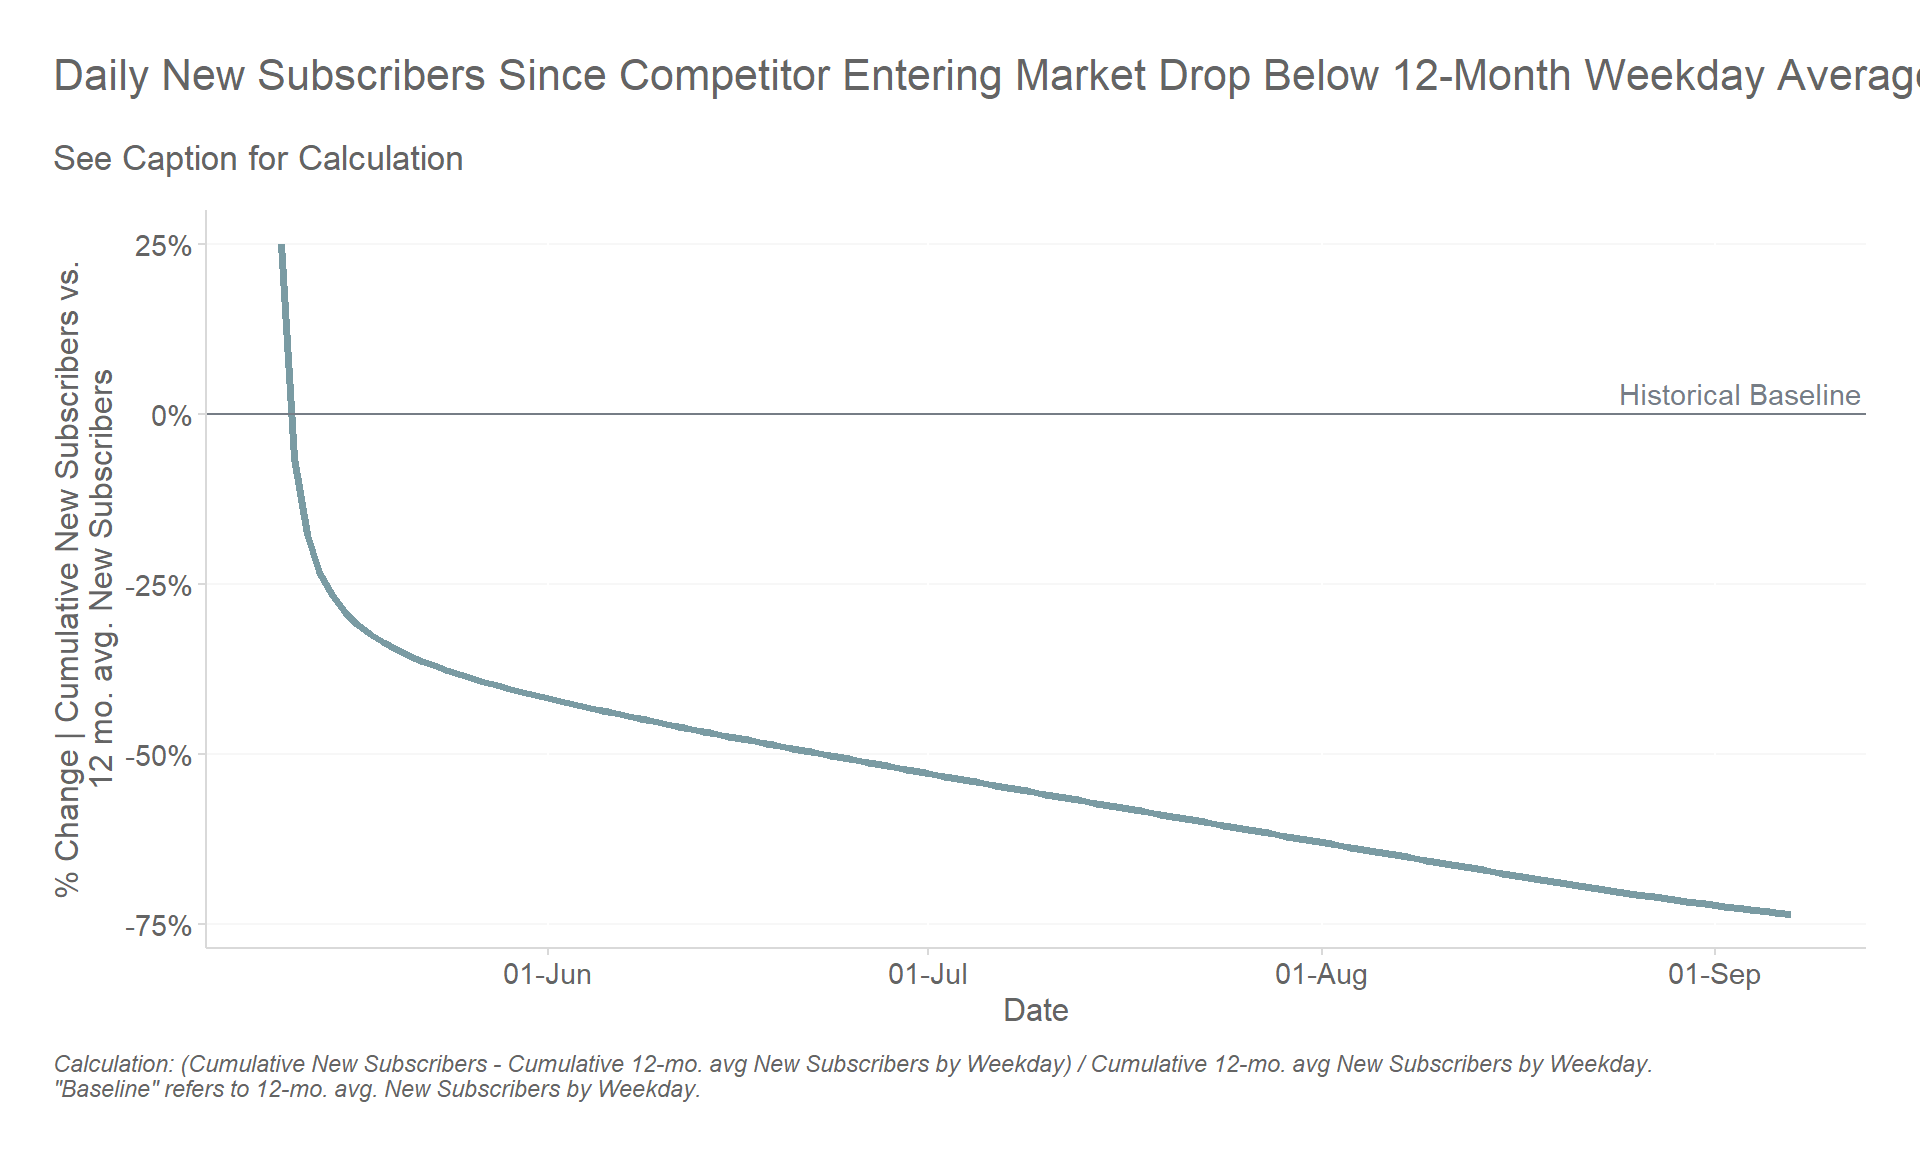
Daily performance lagged the 6–12 month trend after entry.
# Specific Zone vs. Nearby Zones vs. Broader Floorplots_section_of_store_analysis <-section_of_store_analysis(comparison_date = date_competition_enters)plots_section_of_store_analysis$plots$overview
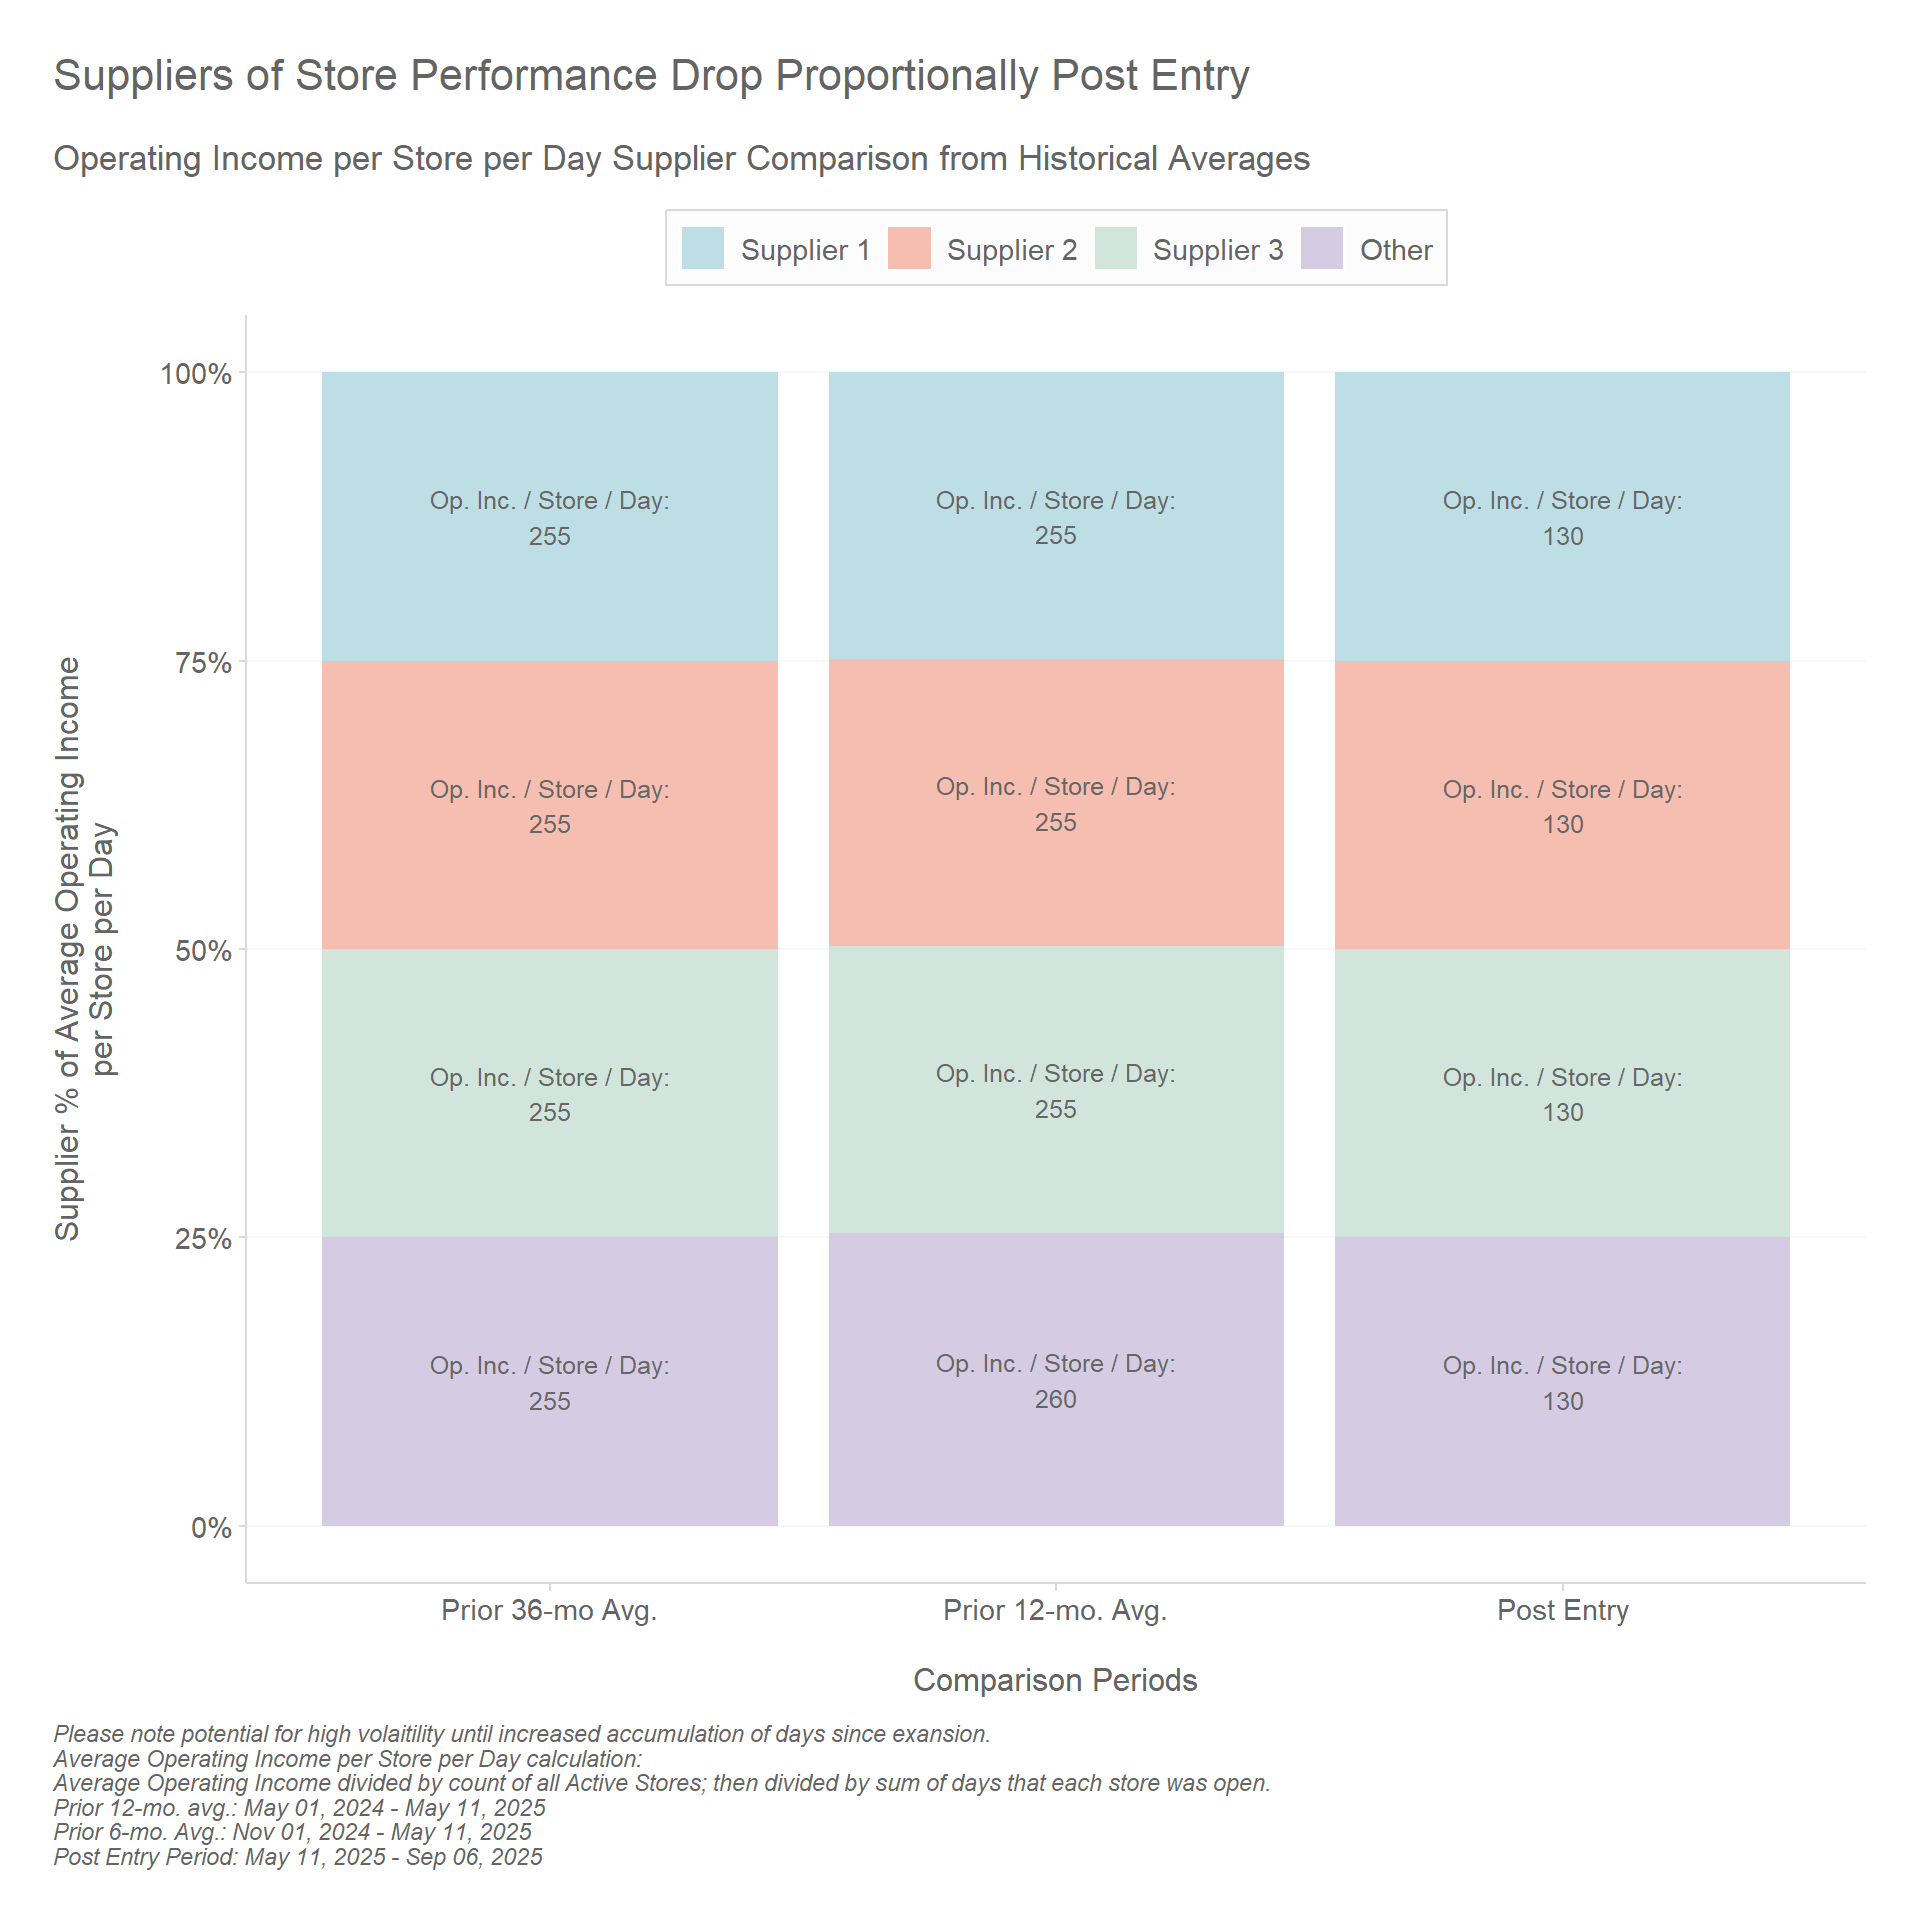
3 Supplier Performance has Dropped Proportionally
Key suppliers lost volume in line with subscriber erosion; supplier mix remained steady.